How to Read Trading Charts and Price Movements
Understanding Trading Charts and Price Movements
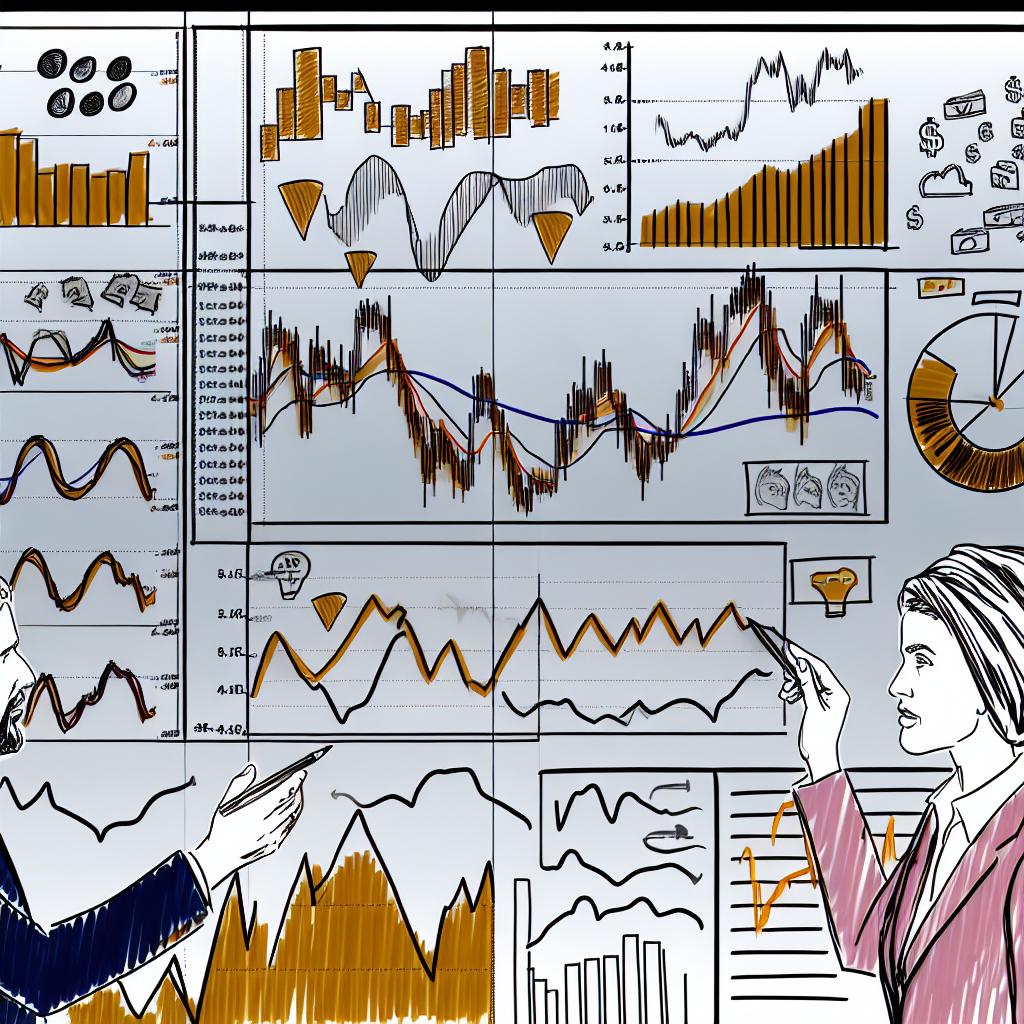
When venturing into the world of trading, one of the essential skills to master is reading trading charts and understanding price movements. This knowledge is crucial for making informed trading decisions. In this article, we will delve into the components of trading charts, different types of charts, and how to interpret them.
Components of a Trading Chart
Before diving into chart analysis, it’s important to understand the basic components of a trading chart. Trading charts primarily display price data over a specific period. Key components include:
Date Range: This indicates the period covered by the chart, which could be minutes, days, weeks, or months.
Price Axis: Typically located on the right side of the chart, it shows the range of prices over the selected time period.
Volume: Volume refers to how much of a given asset was traded during a certain period, often displayed as bars at the bottom of the chart.
Types of Trading Charts
Various chart types can be employed depending on the trader’s preference and the type of analysis being conducted.
Line Charts
Line charts are the simplest form of trading charts. They plot a single line connecting closing prices over a specified time period. This simplicity makes them easy to understand but may lack nuanced information available in more complex charts.
Candlestick Charts
Candlestick charts are favored by many traders for their detailed price information and visual appeal. Each candlestick represents a specific time period with four main values: open, close, high, and low. Candles can also be color-coded to immediately alert traders to uptrends or downtrends. For an in-depth guide on reading candlestick charts, you can visit this candlestick chart guide.
Bar Charts
Similar to candlestick charts, bar charts also provide information on opening, closing, high, and low prices. They are less visually intuitive compared to candlesticks but are preferred by some traders for their straightforwardness.
Interpreting Price Movements
In trading, price movements are crucial for determining entry and exit points. Understanding patterns and signals on charts is essential.
Trends: Recognizing trends is the first step in interpreting price movements. Trends can be upward, downward, or sideways. An upward trend is identified when prices create higher highs and higher lows, while a downward trend is characterized by lower highs and lower lows.
Support and Resistance: These are levels at which the price consistently stops and reverses direction. Support is where a price decline tends to pause due to increased buying interest, whereas resistance is where an uptrend pauses due to a selling interest. Identifying these levels can help traders make buy or sell decisions.
Indicators: Technical indicators, such as moving averages and the Relative Strength Index (RSI), are tools that use mathematical calculations based on the price, volume, or open interest of a security. They provide insights into price trends and potential reversal points.
Deep Dive into Chart Patterns
Chart patterns play a critical role in technical analysis and are formed by the price movements of a financial instrument being graphically represented on a chart. Learning to recognize these patterns can significantly aid traders in forecasting future price movements.
Continuation Patterns
Continuation patterns signal that the ongoing trend is likely to continue after a brief consolidation period. Common examples include triangles, flags, and pennants.
Triangles: Triangles are formed when the price moves within converging trendlines. An ascending triangle shows a potential breakout in an uptrend, while a descending triangle indicates a potential drop in a downtrend.
Flags and Pennants: After a strong price movement, the price often consolidates within parallel lines (flags) or converging lines (pennants) before continuing in the direction of the previous move.
Reversal Patterns
Reversal patterns suggest a change in trend direction. Identifying these patterns can be crucial in determining when to enter or exit positions.
Head and Shoulders: This pattern resembles a head with two shoulders, indicating a potential trend reversal. It can appear as a top or bottom formation.
Double Tops and Bottoms: A double top hints at the end of an uptrend, while a double bottom suggests the end of a downtrend. These patterns are identified when the price tests a support or resistance level twice without breaking through.
Using Technical Indicators Effectively
Technical indicators are invaluable tools that can provide additional confirmation of price movements and trends. While numerous indicators are available, understanding how to use them in conjunction with chart analysis is vital.
Moving Averages
Moving averages smooth out price data by creating a constantly updated average price. The most common types are the Simple Moving Average (SMA) and the Exponential Moving Average (EMA). These averages can help identify the overall direction of a trend by reducing noise caused by price fluctuations.
Relative Strength Index (RSI)
The RSI is a momentum oscillator that measures the speed and change of price movements on a scale of 0 to 100. Values above 70 indicate that an asset may be overbought, while values below 30 suggest it may be oversold.
Moving Average Convergence Divergence (MACD)
The MACD is a trend-following momentum indicator that shows the relationship between two moving averages of a security’s price. It can help traders identify potential buy and sell signals.
Implementing Risk Management
While understanding chart patterns and technical indicators is important, effective risk management strategies should never be overlooked. Ensuring a balanced approach to risk can safeguard against significant losses.
Stop-Loss Orders: Placing stop-loss orders allows traders to limit potential losses on a position by triggering a sell order if the asset’s price falls to a predetermined level.
Position Sizing: Calculating the size of a position based on account size and risk tolerance ensures that no single trade can detrimentally impact a trading account.
Continuous Learning and Adapting
Trading is an ever-evolving domain, and staying updated with new strategies and market dynamics is crucial. Engaging with educational resources and learning from experienced traders can bolster one’s analytical skills.
Webinars, online courses, and trading platforms offering demo accounts provide opportunities for skill enhancement. As technology and markets change, being adaptable and willing to learn new methodologies will keep traders prepared for future challenges.
Mastering the art of reading trading charts and interpreting price movements is a fundamental aspect of successful trading. Whether you are a beginner or an experienced trader, continuous learning is key to staying ahead in the dynamic world of trading.